
Net Collection Rate vs Gross Collection Rate: Formulas, Benchmarks and Which One to Trust
Net collection rate vs gross collection rate comes down to the denominator: gross collection rate divides payments by total billed charges, while net collection rate divides payments by charges minus contractual adjustments. Gross rate reflects fee schedule and contracts, and net rate shows how much collectible revenue a practice actually collected.
A practice that collects $437,000 on $1,000,000 in billed charges can be performing very well or very poorly, and the gross rate alone cannot say which. This guide explains net collection rate vs gross collection rate, gives both formulas, shows four worked examples, lists the benchmarks that have a named source and ends with a ten-question self-assessment checklist.
Gross vs net collection rate: key numbers at a glance
Only a few collection-rate figures carry a named source, and the rest are practical conventions. Table 1 separates the two so a practice manager can see which numbers come from published guidance and which are goals chosen by the practice.
Key numbers cheat sheet
| Metric | Practical target/range | Review frequency | Source type |
| Net collection rate | At least 95%; 97% to 99% described as optimal | Monthly, on a rolling 12-month view | Published guidance |
| Bad debt and unnecessary write-offs | Below 3% of total expected collections | Monthly | Published guidance |
| Gross collection rate | No universal target; low figures are normal | Quarterly, to check fee schedule | Practical |
| Gross rate, cardiology median (2003) | 44.6% | Reference only | Named data, dated |
| Net (adjusted) rate, cardiology median (2003) | 96.61% | Reference only | Named data, dated |
| Net rate by payer group | Each group near the practice target; investigate any group more than 3 to 5 points lower | Monthly | Practical target |
| Contractual adjustment review | Compare posted adjustments with contract fee schedules | Quarterly | Practical target |
Source type: Published guidance = HFMA’s published article on provider KPIs (net collection minimum 95%, optimal 97% to 99%; bad debt below 3%). Named data, dated = MGMA figures for cardiology from 2003, reported by Physicians Practice and shown only to illustrate the gap between the two rates; they are not current benchmarks. Practical = common industry convention and Aspect Billing Solutions’ working guidelines, not a mandate.
What is the difference between net and gross collection rate?
The only difference is what sits under the fraction. Gross collection rate divides total payments by total billed charges, so it falls whenever the fee schedule is higher than what payers allow. Net collection rate removes contractual adjustments, the amounts a practice must write off under payer contracts, so the result reflects only revenue the practice could legally collect.
Gross vs net collection rate side by side
| Item | Gross collection rate | Net collection rate |
| Formula | Payments ÷ billed charges × 100 | Payments ÷ (billed charges − contractual adjustments) × 100 |
| Also called | Gross collection ratio | Net collections, adjusted collection rate |
| Answers the question | How much of the fee schedule turns into cash? | How much collectible revenue did we actually collect? |
| Affected by | Fee schedule level, payer mix, contract rates | Denials, underpayments, patient balances, write-offs |
| Typical result | Often well below 50% | Commonly above 90% in well-run practices |
| Best use | Fee schedule and contract review | Billing and collections performance |
Sources: formulas follow the definitions in Physicians Practice (gross = collections ÷ charges; net = collections ÷ net charges, the payer-agreed allowables) and HFMA’s KPI article (payments ÷ charges net of approved contractual agreements). Typical results are commonly reported across industry sources.
Competing guides define the terms inconsistently, which is why the two rates get mixed up. One treats gross charges as including contractual adjustments in an example, another calls net collection “cash collection.” To avoid that drift, write the formula, the time window and the treatment of bad debt into the practice’s metric definitions before comparing any month or any benchmark.
A contractual adjustment is the difference between a billed charge and the allowed amount a payer agreed to pay. Patient deductible and coinsurance stay in the allowed amount, so they stay in the net denominator. Counting only payer payments in the numerator while keeping patient responsibility in the denominator makes the net rate look worse than it is, so include both. See the guide to patient responsibility at the front desk for how the patient share is collected.
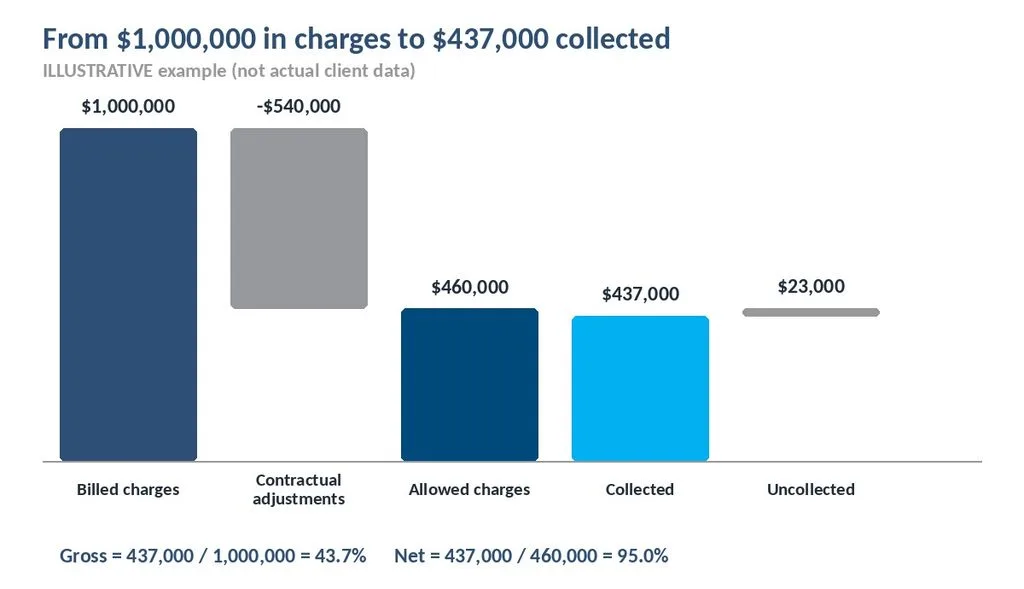
How do you calculate each rate? Four worked examples
Each calculation needs three inputs from the practice management system: billed charges, contractual adjustments and payments, all for the same service period. The four examples below are illustrative, open with their formulas and can be rerun with a practice’s own report totals.
Example 1: both rates for one month
Formulas: gross = payments ÷ charges × 100; net = payments ÷ (charges − contractual adjustments) × 100. Illustrative scenario (not an actual client record): a practice bills $1,000,000, posts $540,000 in contractual adjustments and collects $437,000. Gross is 437,000 ÷ 1,000,000 = 43.7%. Allowed charges are $460,000, so net is 437,000 ÷ 460,000 = 95.0%.
Example 2: a blended net rate that hides a payer group
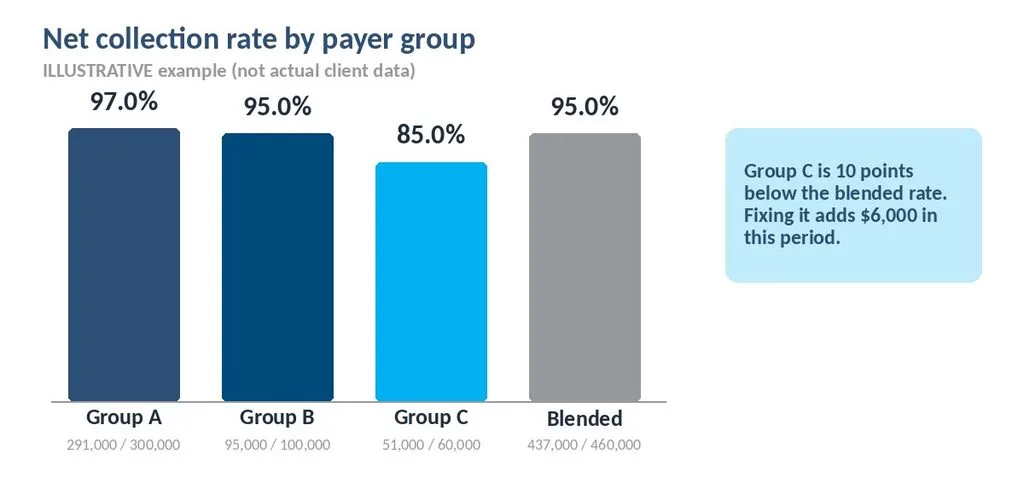
Formula: group net rate = group payments ÷ group allowed charges × 100. Illustrative scenario (not an actual client record): Group A has $300,000 allowed and $291,000 collected, or 97.0%. Group B has $100,000 allowed and $95,000 collected, or 95.0%. Group C has $60,000 allowed and $51,000 collected, or 85.0%. Blended, 437,000 ÷ 460,000 = 95.0%, which hides Group C.
Example 3: what a few points are worth
Formula: dollars uncollected = allowed charges × (1 − net rate). Illustrative scenario (not an actual client record): at 95.0% on $460,000 allowed, $23,000 is uncollected. Raising Group C from 85.0% to 95.0% adds $6,000, because 10% of $60,000 is $6,000. Lifting the whole practice from 95.0% to 97.0% adds 2% of $460,000, which is $9,200 in the same period.
Example 4: how definitions and timing move the number
Illustrative scenario (not an actual client record): if the practice excludes $8,000 of true bad debt from the denominator, net becomes 437,000 ÷ 452,000 = 96.7%, a gain from definition alone. Timing matters too. In a month with $110,000 allowed and $120,000 collected, mostly from earlier claims, net reads 109.1%. A rolling 12-month view avoids that distortion.
How to use these numbers correctly
Compare like with like: one payer group against its own history, and one specialty against similar practices. One missed benchmark is a signal to investigate, not a verdict. When the net rate dips, split the month by payer, by denial reason and by age of balance before changing any process. The revenue cycle metrics guide shows where each number sits on a dashboard.
Which rate should a practice trust, and when does each one matter?
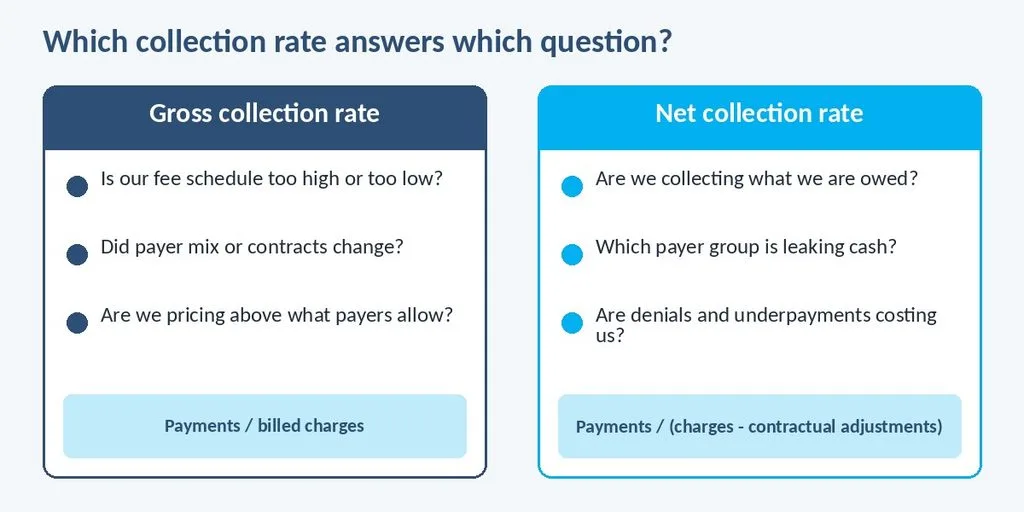
Trust the net rate to judge billing performance and use the gross rate to judge pricing and contracts. A low net rate points to denials, underpayments or unpaid patient balances. A falling gross rate with a steady net rate usually points to a fee schedule change or a shift in payer mix, not to collection problems.
In billing audits, a common pattern is a practice that raises its fee schedule and sees the gross rate fall, then concludes collections have worsened. The net rate stays flat because the allowed amounts did not change. Read the two rates together, and let the net rate decide whether staff and billing workflows need attention.
The reverse pattern is more costly. Our team often sees a strong blended net rate used to reassure an owner while one payer group sits ten points lower, because small groups barely move the average. Track the net rate by payer, and review the denial rate guide when one group lags.
What is a good net and gross collection rate?
A commonly cited good net collection rate is at least 95%, with 97% to 99% called optimal in HFMA’s published KPI guidance. No major body sets a universal target for the gross rate, because fee schedules differ. Table 3 shows the figures with a named source and labels the rest as practical.
Benchmarks and their sources
| Benchmark | Figure | Named source | How to read it |
| Net collection rate minimum | 95% | HFMA, provider KPI article | Published guidance, not a payer or CMS rule |
| Net collection rate optimal | 97% to 99% | HFMA, provider KPI article | Published guidance |
| Bad debt and write-offs | Below 3% of expected collections | HFMA, provider KPI article | Published guidance |
| Cardiology gross median | 44.6% (2003) | MGMA data via Physicians Practice | Dated; shows that low gross rates are normal |
| Cardiology net median | 96.61% (2003) | MGMA data via Physicians Practice | Dated; not a current benchmark |
| Small-group net rate gap | Investigate at 3 to 5 points below practice rate | Practical | Illustrative guideline |
Sources: HFMA article “7 KPIs providers should be tracking” (published April 6, 2023; updated September 11, 2024); Physicians Practice, “Understanding collection rates,” quoting MGMA data from 2003. Benchmarks vary by specialty, payer mix and region.
Read the HFMA KPI article for its definition of net adjusted collections, and the Physicians Practice explanation of collection rates for the MGMA comparison. Because the MGMA figures date from 2003, treat them as proof that gross and net rates differ widely, not as a target for any current practice.
How do payer rules change gross and net collection rates?
Payer type changes the allowed amount, the patient’s share and the adjustment a practice must post. Table 4 summarizes where each payer type pushes the two rates. It is illustrative except where a source is named, since contracts differ by plan and state.
Payer differences (illustrative except where a source is named)
| Payer type | Allowed amount and adjustments | Patient share | What to check |
| Medicare (fee-for-service) | Allowed amount follows the Medicare fee schedule; providers who accept assignment treat it as the full charge, and others may charge up to 15% more | Usually 20% of the approved amount after the Part B deductible | Participation status; PFS Look-Up Tool |
| Medicare Advantage | Plan contract sets rates; rates may differ from fee-for-service | Set by the plan | Contract rate sheet |
| Medicaid | State fee schedule; often lower than commercial rates | State rules; often nominal | State Medicaid fee schedule |
| Commercial plans | Contract fee schedule per plan; adjustments vary widely | Deductible, copay and coinsurance by plan | Contract and remittance advice |
| Self-pay | Practice’s own discount policy | Full balance | Written discount and payment policy |
Sources: AARP (Medicare assignment, 15% balance billing limit, 20% coinsurance); CMS Physician Fee Schedule Look-Up Tool. Illustrative where no source is named; actual terms vary by contract.
For Medicare, the allowed amount is a published rate. CMS’s PFS Look-Up Tool shows the locality payment for each code, and AARP’s explanation of Medicare assignment describes the approved amount and the 15% limit for non-accepting providers. Your exact commercial rates depend on each contract, so compare posted adjustments against the fee schedule on file.
How do you raise a low net collection rate?
Raise the net rate by working backward from the biggest leak, in six steps. Start with the payer group that has the lowest rate, since a fix there moves the blended number the most, and assign each step an owner and a review date.
- Standardize the definition. Write the formula, period and bad-debt treatment into one document so every report uses the same math.
- Split the rate by payer group. Pull payments and allowed charges by payer and rank the groups from lowest to highest.
- Find the leak. For the lowest group, sort unpaid balances into denials, underpayments, unbilled patient balances and timely filing losses.
- Verify adjustments against contracts. Compare posted contractual adjustments with contract fee schedules, and use the underpayment fix guide when payers pay below the contract.
- Fix the patient share. Collect copays at check-in and send statements promptly, using steps from the patient payment collection strategies.
- Re-measure monthly. Recalculate on a rolling 12-month basis and review the A/R days reduction tips when older balances grow.
Pair this work with a broader revenue cycle dashboard and the 15 key metrics checklist, so the net rate sits beside days in A/R and denial rate. If the net rate stays low after these steps, a medical billing audit can show whether the cause is coding, payer behavior or workflow.
How long does it take to improve a net collection rate?
Partial improvement often appears within 30 to 60 days of fixing definitions and working the oldest balances, and a full cleanup commonly takes 90 to 180 days. These are general planning ranges, not guarantees. Because the rate is measured on a rolling basis, older months keep dragging the average even after the process improves.
Which collection rate mistakes distort the picture?
Most distorted collection reports trace to six mistakes, and each has a simple fix, so a practice can work through them in one review meeting. Check them before concluding that the billing team or a payer is at fault, and review the list each quarter alongside the payer split.
- Judging billing by the gross rate. Use the net rate for performance and the gross rate for fee schedule review.
- Mixing definitions. Publish one formula and use it every month, including the same bad-debt treatment.
- Measuring one month in isolation. Use a rolling 12-month view because payments lag charges.
- Skipping the payer split. Review net rates by payer group whenever volume allows.
- Posting contractual adjustments loosely. Verify adjustments against the contract, because wrong write-offs inflate the net rate.
- Ignoring patient balances. Keep patient responsibility in both numerator and denominator, and collect it at the visit.
Quick summary
- Gross rate divides payments by billed charges; net rate divides by charges minus contractual adjustments.
- A commonly cited good net rate is at least 95%, and HFMA’s article calls 97% to 99% optimal.
- Low gross rates are normal and mostly reflect fee schedule level.
- Use a rolling 12-month view; single months can exceed 100%.
- Split the net rate by payer group, because a blended average can hide a weak one.
- Write one definition and keep bad-debt treatment consistent.
Self-assessment: are you measuring collections correctly?
Answer yes or no to each question, using the last 12 months of data wherever a question mentions a rate. The scoring guide below the list shows what the total suggests and what to do next. A “no” is a to-do, not a failure.
- Do you have a written formula for gross and net collection rate?
- Do you calculate both rates on a rolling 12-month basis?
- Is your net collection rate at least 95%?
- Do you track net collection rate by payer group?
- Is no payer group more than 5 points below your overall net rate?
- Are bad debt and unnecessary write-offs below 3% of expected collections?
- Do you compare posted contractual adjustments with contract fee schedules?
- Do you include patient responsibility in your net denominator and numerator?
- Do you review your fee schedule against payer allowables at least yearly?
- Do you review denial and underpayment reports monthly?
Scoring guide
| Yes answers | What it suggests | Next step |
| 9-10 | Measurement and collections look sound | Keep the monthly payer split and annual fee schedule review |
| 6-8 | Gaps worth closing | Fix the “no” items first and re-measure in 60 days |
| 0-5 | Collections may be leaking unseen | Standardize definitions, split by payer and audit adjustments |
Scoring is a practical guide, not a published standard.
When does outside billing support make sense?
Outside support makes sense when internal reporting can no longer explain why collections lag, and the signs usually appear in the payer split before the bank balance. Consider help when several of these five signals are already present, since each one tends to compound the others:
- The net collection rate has stayed below 95% for two or more quarters.
- One payer group sits well below the practice average and nobody owns the fix.
- Reports from the billing system and the finance team disagree on the same month.
- Contractual adjustments are posted without checking the contract.
- Write-offs and bad debt are rising while denial follow-up falls behind.
When evaluating a partner, look for payer-level reporting, written metric definitions, experience with your specialty and signed HIPAA safeguards. Aspect Billing Solutions is one example. It provides HIPAA-compliant, end-to-end medical billing and coding, credentialing, eligibility verification and prior authorization, denial management, A/R follow-up and compliance support, with a dedicated agent assigned to each provider. Results vary by practice. The revenue cycle management service page describes the full approach.
Practices that want faster cash can also see how the cash flow improvement tips fit with the rest of the revenue cycle, and how Aspect Billing Solutions’ billing and coding services are organized, before deciding how much to keep in-house.
Final Considerations
Net collection rate vs gross collection rate is not a contest. The gross rate checks pricing and contracts, and the net rate checks how well a practice collects what it is owed. Together they explain a low number faster than either one alone, but only when the formula, period and payer split are written down.
Firm published figures here are HFMA’s stated minimum of 95%, its 97% to 99% optimal range and its 3% bad-debt marker, plus Medicare’s assignment and coinsurance rules. The MGMA medians are dated 2003. The 3 to 5 point payer gap, the timeframe ranges and every worked example are practical or illustrative.
The natural next question is which payer group is pulling your net rate down. To find out, request a collections review from Aspect Billing Solutions and bring twelve months of payments, charges and adjustments by payer, so the review can compare each group with its own history.
Frequently asked questions
What is the difference between net and gross collection rate?
Gross collection rate divides total payments by total billed charges. Net collection rate divides payments by billed charges minus contractual adjustments. Gross reflects fee schedule and contract rates, while net shows how much collectible revenue the practice actually collected. Net is the better measure of billing performance.
What is a net collection rate?
Net collection rate is the percentage of collectible revenue a practice actually collected. The formula is payments divided by charges minus contractual adjustments, multiplied by 100. Practices should define the time window and bad-debt treatment in writing so monthly figures stay comparable.
What is a good net collection rate?
A commonly cited good net collection rate is at least 95%. HFMA’s published KPI article lists 95% as a minimum and 97% to 99% as optimal. These are guidance figures, not payer or CMS rules, and results differ by specialty and payer mix, so compare each group to its own history.
What is a good gross collection rate?
No universal target exists for gross collection rate, because it depends on the fee schedule. Low figures are normal: MGMA data for cardiology from 2003 showed a 44.6% median. Use the gross rate to review pricing and contracts, and use the net rate to judge billing performance.
Why is my gross collection rate so low?
Gross collection rate is low when billed charges sit well above payer allowed amounts, since the difference is written off as contractual adjustments. A low gross rate with a healthy net rate is usually a fee schedule effect, not a billing problem. Check the net rate before reacting.
Can net collection rate be over 100%?
Yes, in a single month. Payments often cover claims from earlier periods, so collections can exceed that month’s allowed charges. A rolling 12-month calculation smooths timing differences. Persistent rates above 100% over a long period suggest a calculation error, such as mismatched periods or misposted adjustments.
Sources and methodology
(a) Published standards and definitions from named bodies
- HFMA, “7 KPIs providers should be tracking” (net adjusted collection definition; net collection minimum 95%, optimal 97% to 99%; bad debt and unnecessary write-offs below 3% of expected collections). This is published guidance, not a regulation.
- CMS, Physician Fee Schedule Look-Up Tool (locality payment amounts for Medicare services).
- AARP, “Define term: Medicare assignment” (Medicare-approved amount; up to 15% more for providers who do not accept assignment; usually 20% of the approved amount after the Part B deductible).
(b) Named benchmarking data providers
- MGMA data (2003), reported by Physicians Practice, “Understanding collection rates”: cardiology median gross collection rate 44.6% and median net (adjusted) rate 96.61%. The data are over two decades old and appear only to show the gap between the two rates.
(c) Practical or illustrative targets from general industry sources
- The 3 to 5 point payer gap, the rolling 12-month view and the review frequencies are practical guidelines.
- The 30 to 60 day and 90 to 180 day improvement ranges are general planning ranges, not guarantees.
- All worked examples are labeled illustrative and use fictional figures.
(d) Survey or study data
None. No survey or study data are cited in this article.
Results vary by practice, payer and state. Figures reflect information available in October 2026, and fee schedules and payer policies change annually.