
Top-Rated Neurology Billing Company in New York
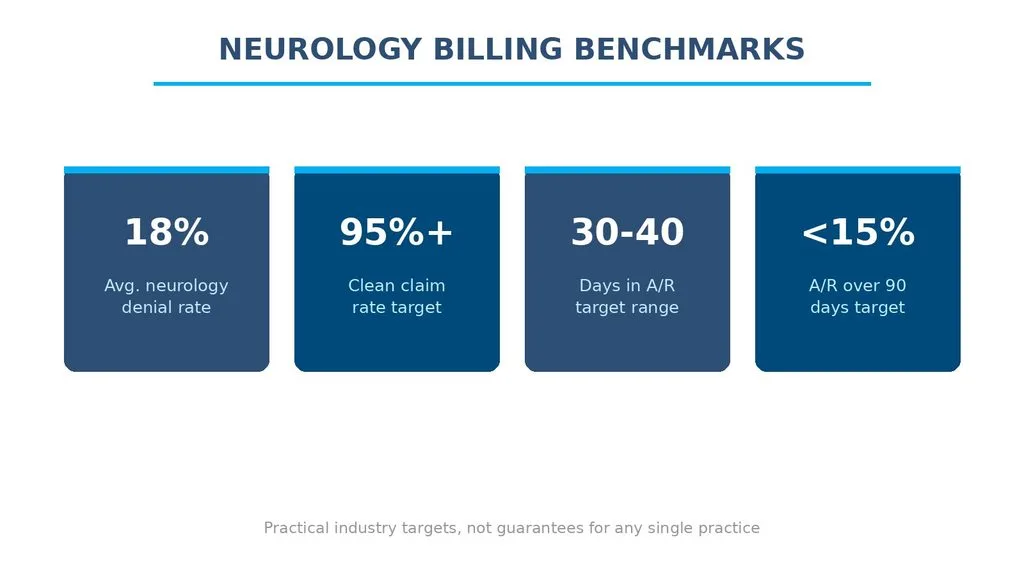
A top-rated neurology billing company in New York pairs neurology-specific coding accuracy with fast prior authorization turnaround and strong regional payer relationships. Practical industry targets are a clean claim rate above 95% and an overall denial rate under 10%, against a commonly reported neurology average near 18%. The strongest partners track these figures monthly and correct course before small gaps turn into lost revenue.
Picking a billing partner for a neurology practice in New York is a financial decision, not just an administrative one. EEG, EMG, and imaging claims face denial rates well above other specialties, and New York’s mixed managed-Medicaid and commercial payer landscape adds its own friction. This guide walks through the metrics that separate a top-rated neurology billing company in New York from a generic vendor, shows how to calculate each one, and sets realistic timeframes for improvement. A self-assessment checklist near the end lets you score your current setup against the same benchmarks a strong billing partner would track.
The Neurology Billing Scorecard
| Metric | Practical Target / Range | Review Frequency | Primary Source |
| Neurology-specific denial rate | ~18% commonly reported average, vs. 5-10% for other specialties | Monthly | MGMA benchmarking (commonly reported) |
| Overall claim denial rate | 9-12% average; top-quartile under 5% | Monthly | MGMA / HFMA |
| Clean claim rate | 95-98% target; 98%+ best-in-class | Monthly | MGMA / HFMA |
| Days in A/R | 30-40 days target; 25 or fewer best-in-class | Monthly | MGMA industry standards |
| Net collection ratio | 95-99%; 98-100% best-in-class | Quarterly | MGMA industry standards |
| A/R over 90 days | Under 15% of total; under 10% best-in-class | Monthly | MGMA industry standards |
| First-pass resolution rate | 85-90%; above 90% best-in-class | Monthly | Commonly reported industry range |
Source key: “MGMA / HFMA” = a published benchmarking figure from that named association. “MGMA industry standards” = a range MGMA’s benchmarking data is commonly cited as supporting, not a single mandated number. “Commonly reported industry range” = a figure repeated consistently across multiple industry publications rather than one named body’s official standard.
Why Neurology Billing Runs Hotter Than Most Specialties?
Neurology mixes time-based evaluation codes, complex procedural codes for EEG, EMG, and nerve conduction studies, and costly injectable treatments such as Botox for chronic migraine. Each category carries its own medical necessity documentation standard. This combination is a large part of why neurology denial rates are commonly reported near 18%, versus roughly 5% to 10% across other specialties, according to MGMA benchmarking. The gap is not about sloppier billers; it reflects a claim mix that payers scrutinize more heavily than routine office visits.
Prior Authorization Is the Biggest Single Driver
MRI of the brain and spine, video EEG monitoring, EMG and nerve conduction studies, and Botox for migraine typically require prior authorization before a payer will even consider the claim. A missed or expired authorization is one of the most common denial triggers in neurology. Advanced imaging denials on Medicare Advantage plans run close to 4.94% on their own, according to KFF analysis, and rates climb higher for spine MRI specifically.
A billing partner that logs authorization numbers and expiration dates against the scheduled date of service — a workflow covered in more depth in this neurology billing process breakdown — prevents a large share of these denials before a claim is ever submitted.
New York’s Payer Mix and Prompt-Pay Rules
New York requires insurers and HMOs to pay undisputed claims within 45 days of receipt, or 30 days when submitted electronically, under New York Insurance Law Section 3224-a, commonly known as the state’s Prompt Pay Law. That protection only helps a practice that submits clean claims and follows up systematically — a payer that never receives a complete claim has nothing to pay promptly. New York’s blend of commercial carriers, Medicaid managed care plans, and Medicare Advantage products each apply their own authorization and documentation rules, which is one reason a billing company with specific New York experience tends to outperform a national generalist in this market.
The 4 Metrics That Actually Matter
The metrics below are the ones a genuinely strong billing partner reports on regularly, not just at contract renewal. Each includes the formula and a worked example so you can calculate it yourself from your own numbers.
Clean Claim Rate
Formula: Clean Claim Rate = (Clean Claims Submitted ÷ Total Claims Submitted) × 100.
Worked example: a practice submits 480 neurology claims in a month, and 452 pass through without edits or rejections. 452 ÷ 480 × 100 = 94.2%, just under the commonly cited 95% target reported by MGMA and HFMA benchmarking.
Denial Rate
Formula: Denial Rate = (Denied Claims ÷ Total Claims Submitted) × 100.
Worked example: of those same 480 claims, 61 are denied on first submission. 61 ÷ 480 × 100 ≈ 12.7%, above the 9%-12% national average MGMA reported for 2024 and well above the sub-5% top-quartile mark.
Days in Accounts Receivable (A/R)
Formula: Days in A/R = Total Accounts Receivable ÷ (Total Charges ÷ Number of Days in the Period).
Worked example: a practice carries $420,000 in outstanding A/R against $360,000 in charges over a 30-day month. Average daily charges are $12,000, so 420,000 ÷ 12,000 = 35 days — inside the 30-40 day benchmark range.
Net Collection Ratio
Formula: Net Collection Ratio = (Payments Received ÷ (Charges − Contractual Adjustments)) × 100.
Worked example: a practice collects $300,000 against $310,000 in allowed charges after contractual adjustments. 300,000 ÷ 310,000 × 100 ≈ 96.8%, inside the 95%-99% benchmark band MGMA data supports.
Why Your Overall Denial Rate Is Lying to You?
A practice-wide denial rate of 9% can look comfortably within range while masking a serious issue in one payer segment. The illustrative breakdown below shows how that happens.
Illustrative — not pulled from a single named data source. Actual figures vary by practice; verify against your own payer-level reporting.
| Payer Segment | Illustrative Denial Rate | Note |
| Commercial PPO | 4% | Within top-quartile range |
| Commercial HMO | 7% | Near industry average |
| Medicaid managed care | 11% | Above target — worth a closer look |
| Medicare Advantage | 19% | Well above target — investigate first |
In this illustrative scenario, the blended 9% average hides a Medicare Advantage denial rate more than double the overall figure. Reviewing denials by payer segment, not just as one company-wide number, is what catches this kind of gap before it compounds.
What “Top-Rated” Should Actually Mean for a New York Neurology Practice?
Credentialing and Payer Enrollment Speed
Slow payer credentialing delays every claim behind it, regardless of how accurate the coding is. Re-credentialing on a set cycle, rather than scrambling after a lapse, keeps a provider in-network without a gap in reimbursement.
Specialty-Specific Coding Accuracy
Neurology coding accuracy depends on correct use of CPT and ICD-10 codes for EEG, EMG, and nerve conduction studies, plus the modifiers that separate a bundled procedure from a separately billable one. A partner fluent in these distinctions catches errors before submission rather than after a denial arrives.
Denial Management Workflow
Denial management is where the most recoverable revenue tends to sit. Industry-wide, HFMA reporting indicates roughly 65% of denied claims are never appealed at all — meaning a large share of denied revenue is simply written off rather than pursued. A structured denial management workflow that tracks root cause by CPT code and payer, and routes denials to appeal by default, recovers revenue that a reactive process leaves on the table.
For a deeper look at where neurology claims commonly go wrong, see neurology billing with proven strategies.
A closer look at building an effective denial management workflow covers root-cause tracking and appeal routing in more detail.
Credentialing timelines and common pitfalls are covered in credentialing mistakes that delay payments. For a full walkthrough of applicable codes, see neurology billing CPT codes and neurology billing CPT modifiers.
What Aspect Billing Solutions Does Differently?
The criteria above only matter if a billing partner actually operates that way day to day. Here is the specific gap Aspect Billing Solutions’ process is built to close at each point:
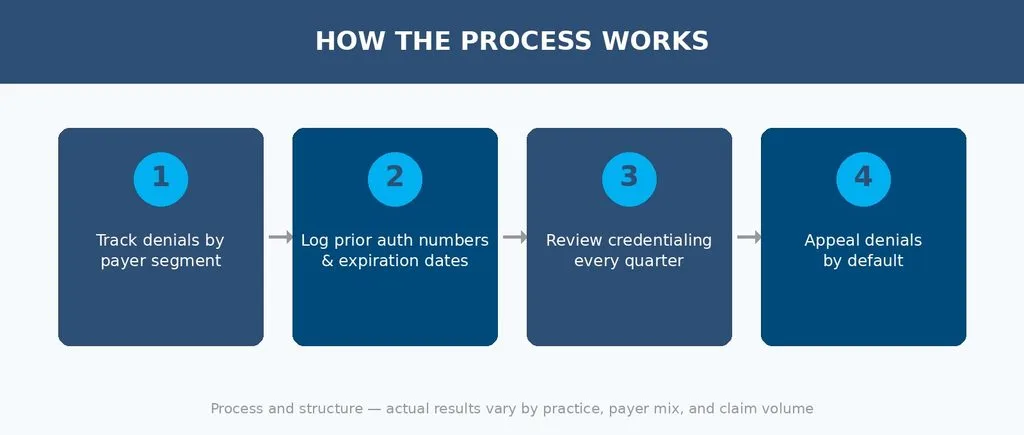
- Most billing setups report one blended denial rate. Aspect breaks denials out by commercial, Medicaid managed care, and Medicare Advantage, so a spike in one segment does not hide inside a comfortable overall average.
- A missed or expired authorization is one of the most common denial triggers in neurology. Aspect logs authorization numbers and expiration dates against the scheduled date of service, rather than tracking them from memory or an ad hoc spreadsheet.
- Credentialing is often reviewed reactively, after a claim already bounced for an out-of-network denial. Aspect reviews credentialing status on a set quarterly cycle, before that gap opens.
- HFMA reporting indicates roughly 65% of denied claims industry-wide are never appealed at all. Aspect’s workflow routes denials to appeal by default, with root cause tracked by CPT code and payer, instead of defaulting to write-off.
- A dedicated agent is assigned to each provider, so the person following your authorizations, denials, and appeals from start to finish is the same person who knows your specific payer mix — not a rotating general claims queue.
This is a description of process and structure, not a performance guarantee. Actual results depend on a practice’s starting point, payer mix, and claim volume — which is exactly why a free consultation starts with a look at your own numbers rather than a general promise.
Reading the Metrics Like a Pro
A benchmark is only useful compared like-for-like: same specialty mix, a similar payer blend, comparable practice size, and the same reporting period. Comparing a small solo neurology practice’s denial rate against a large multi-specialty group’s figure will mislead more than it informs. One missed benchmark in a single month is a signal to investigate, not a verdict on the entire billing relationship — look for a pattern across two or three reporting periods before concluding there is a systemic issue.
Timeframe to Improvement
| Milestone | What to Expect | General Timeframe |
| Clean claim rate improvement | Partial gains as scrubbing rules and front-end checks tighten | 30-45 days |
| Denial rate reduction | Meaningful drop as authorization and documentation gaps close | 60-90 days |
| Days in A/R normalization | Backlog worked down; range stabilizes fully | 90-180 days |
| Net collection ratio | Full benchmark range typically reached | 120-180 days |
These are general planning ranges based on commonly reported RCM transition patterns, not a guarantee for any specific practice. A practice with a large existing A/R backlog or several open credentialing applications may take longer to see full results, while a smaller, cleaner starting position can move faster.
What This Means for Your Practice?
- Neurology denial rates commonly run near 18%, versus 5-10% industry-wide, per MGMA benchmarking.
- A clean claim rate of 95%+ and a denial rate under 10% are practical targets, not mandated figures.
- Days in A/R of 30-40 days and a net collection ratio of 95-99% reveal underlying cash-flow health.
- A blended denial rate can hide a payer-specific problem — check Medicare Advantage separately.
- New York’s Prompt Pay Law (Ins. Law §3224-a) only helps once a claim is clean and properly submitted.
- Expect partial improvement in 30-90 days and closer-to-full benchmark performance in four to six months.
- One missed benchmark is a signal to investigate, not a verdict on the whole billing relationship.
Is Your Billing Partner Passing the Test?
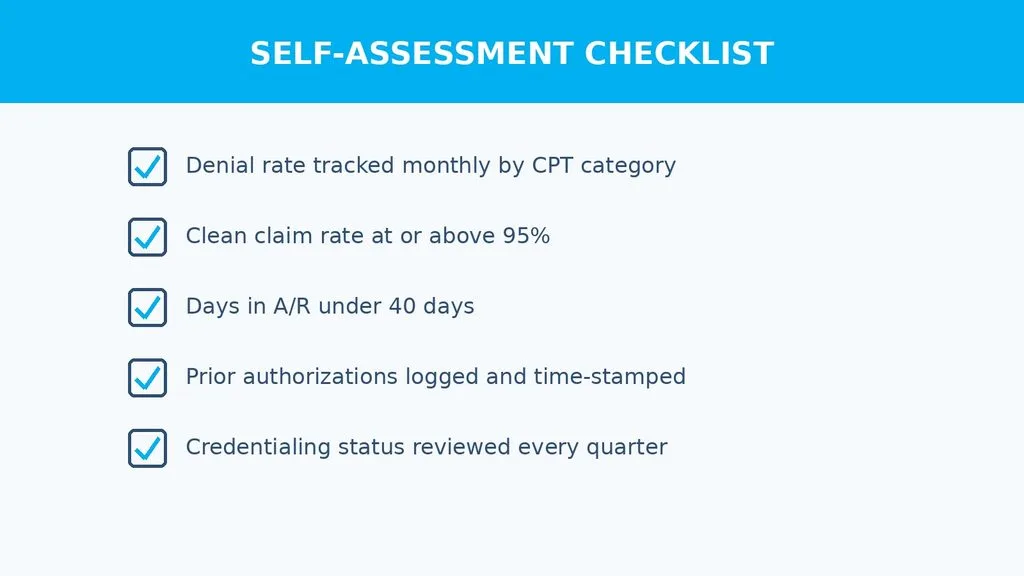
Answer yes or no to each question, then check the scoring guide below.
- 1. Is your clean claim rate at or above 95%?
- 2. Is your overall denial rate below 10%?
- 3. Do you track denials by payer segment rather than one blended number?
- 4. Is your days in A/R at or under 40 days?
- 5. Is your A/R over 90 days under 15% of total outstanding balances?
- 6. Do you log prior authorization numbers and expiration dates before the date of service?
- 7. Is credentialing status reviewed at least once per quarter for every payer?
- 8. Do denied claims get appealed by default rather than written off?
- 9. Is your net collection ratio at or above 95%?
- 10. Can you view your Medicare Advantage denial rate separately from commercial?
Scoring: 8-10 “yes” answers suggests a strong, well-monitored billing process. 5-7 suggests targeted fixes would help, often starting with denial tracking by payer segment. 0-4 suggests meaningful revenue is likely at risk and a fuller review is worth prioritizing.
When to Consider Professional Support?
A few signals tend to show up together when an in-house billing setup has hit its limits:
- Denial rate has stayed above 10% for more than one reporting quarter.
- Staff turnover keeps resetting institutional knowledge of payer-specific rules.
- Credentialing applications regularly slip past their target completion date.
- Nobody on staff has time to appeal denials, so most get written off instead.
- Reporting shows one blended number rather than a breakdown by payer or CPT code.
When those signals appear together, outside support is usually structured around a few things: a dedicated point of contact who knows the practice’s payer mix, documented workflows for authorization and denial follow-up, and reporting broken out by segment rather than one blended figure — the same structure described in the section above.
Illustrative scenario (not an actual client record): using the 480-claims-a-month example from earlier in this guide, closing just a 5-percentage-point gap — from a 12% denial rate down to the 5%–7% top-quartile range — works out to roughly 24 to 34 fewer denied claims a month. At a modest $200 average allowed charge, that is on the order of $5,000 to $6,800 a month in claims that would otherwise sit in appeals or get written off. This is hypothetical math to illustrate scale, not a projection for any specific practice’s results.
Aspect Billing Solutions
ABS provides HIPAA-compliant medical billing and coding for US healthcare providers, including neurology practices, covering claim and denial management, eligibility verification, prior authorization, accounts receivable follow-up, and credentialing. The company offers a free, no-commitment consultation to review a practice’s current numbers — its own denial rate, payer mix, and A/R aging. If your denial rate has sat above 10% for more than a quarter, that review is the fastest way to see exactly where the leak is, and what closing it could look like for your specific claim volume.
Learn more at aspectbillingsolutions.com.

Final Considerations
Neurology billing carries more risk than most specialties, but the risk is measurable. Clean claim rate, denial rate, days in A/R, and net collection ratio give a practice a concrete way to evaluate whether a billing partner — in-house or outsourced — is actually performing.
A few numbers in this guide are firm, published figures: MGMA and HFMA’s benchmark ranges for clean claim rate, denial rate, days in A/R, and net collection ratio, and New York Insurance Law §3224-a’s 45-day (30-day electronic) prompt pay requirement. Others, like the payer-segment breakdown table, are illustrative examples meant to show a pattern, not a specific claim about any practice’s actual numbers. Keep that distinction in mind when comparing your own figures against anything in this guide.
Whichever path a practice takes, tracking these numbers monthly — by payer segment, not just as one blended figure — is the single habit most likely to catch a problem while it is still small.
Frequently Asked Questions
What is a top-rated neurology billing company in New York?
It’s a billing partner that combines accurate neurology-specific coding, fast prior authorization handling, and New York payer experience, and reports results by payer segment rather than one blended number. Look for documented denial and credentialing workflows, not just marketing claims.
What is a good denial rate for a neurology practice?
A denial rate under 10% is a commonly cited practical target, with top-quartile practices reporting under 5%, according to MGMA and HFMA benchmarking. Neurology practices often run higher than this due to imaging and EEG/EMG authorization requirements, so tracking the trend over time matters more than any single month’s number.
What is a good clean claim rate?
A clean claim rate of 95% or higher is the commonly cited target, with best-in-class practices reaching 98% or above. Anything meaningfully below 90% usually points to front-end issues like eligibility verification or coding accuracy.
Why do neurology claims get denied more often than other specialties?
Neurology combines time-based E/M codes, procedural codes for EEG, EMG, and nerve conduction studies, and high-cost treatments like Botox, each with distinct documentation and prior authorization rules. That combination is why neurology denial rates are commonly reported near 18%, compared with 5-10% across other specialties.
Does New York’s Prompt Pay Law apply to Medicaid managed care plans?
New York Insurance Law §3224-a applies to insurers and HMOs processing health care claims in the state, which generally includes Medicaid managed care organizations licensed under the relevant insurance articles. Specific coverage can vary by plan type, so a billing partner familiar with New York’s regulatory detail is worth having review your specific payer contracts.
How long does it take to switch medical billing companies without disrupting cash flow?
A well-run transition typically overlaps the outgoing and incoming billing processes for 30 to 60 days, so open claims and appeals stay tracked through the handoff. Full benchmark performance under a new partner generally takes four to six months to show up in the numbers.
What credentialing is required for a neurologist joining a New York payer network?
Requirements typically include a current New York medical license, DEA registration, malpractice coverage documentation, and a completed CAQH profile, in addition to each payer’s own application. Timelines vary by payer, which is why quarterly credentialing status reviews help catch delays early.
Should a solo neurology practice outsource billing or keep it in-house?
The decision usually comes down to volume and available staff time: a solo practice without dedicated billing staff often sees more consistent denial follow-up from an outsourced partner. Practices with strong in-house billing staff already hitting the benchmark ranges in this guide may not need to change anything.
What is a good days-in-A/R number for a specialty practice?
A days-in-A/R range of 30 to 40 days is the commonly cited target, with best-in-class practices reaching 25 days or fewer, per MGMA benchmarking. Specialty practices with heavier prior authorization requirements, like neurology, sometimes run slightly higher than primary care.
How much does outsourced neurology medical billing typically cost?
Outsourced billing is most often priced as a percentage of collections, and the exact rate depends on claim volume, complexity, and included services like credentialing. Because pricing varies by vendor and scope, a direct quote based on your practice’s actual claim mix is more useful than a general industry figure.
Sources & Methodology
(a) Published standards and definitions: MGMA and HFMA definitions of denial rate, clean claim rate, days in A/R, and net collection ratio; New York Insurance Law §3224-a (New York State Department of Financial Services), which sets the 45-day / 30-day-electronic prompt pay requirement.
(b) Named benchmarking data providers: MGMA Cost and Revenue Report benchmarking figures, and HFMA’s MAP Keys benchmarking framework, as cited across industry revenue-cycle publications.
(c) Practical and illustrative targets: The payer-segment denial rate breakdown in this article is illustrative, compiled to demonstrate a common pattern rather than pulled from one named data source. Actual figures vary by practice and should be verified against your own reporting.
(d) Survey data: Denial-rate trend figures referencing provider-reported experience draw on the Experian Health State of Claims survey series, as cited in industry revenue-cycle publications.
Actual results vary by practice, specialty mix, and payer contracts. Figures in this article reflect information available at the time of research (September 2026) and are not a guarantee of any specific outcome.